What is Net Promoter Score (NPS)?
Net Promoter Score (NPS) is a quick way to see how loyal your customers are. Rather than asking a long list of questions, it relies on a single one that tells you how strongly people feel about recommending what you offer.
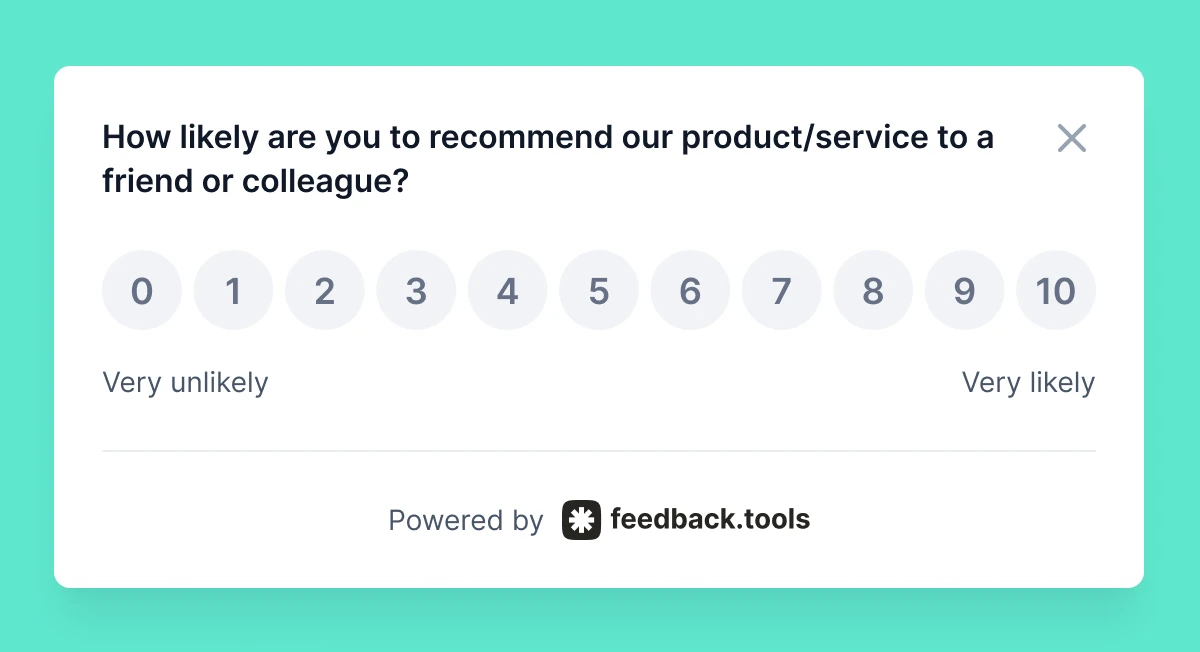
"How likely are you to recommend our product or service to a friend or colleague?" People answer on a 0-10 scale, where 0 means "not at all likely" and 10 means "extremely likely."
NPS is popular because it's easy to track over time and simple to explain across teams. It helps you quantify loyalty, spot trends, and prioritize improvements by focusing on the customers most likely to drive growth through recommendations.
Why NPS Matters
- Predictive power: Strong correlation with revenue growth
- Simplicity: One question, easy to understand and act on
- Comparable: Benchmark against competitors and industry standards
- Actionable: Clear segmentation guides improvement efforts
The NPS Calculation Formula
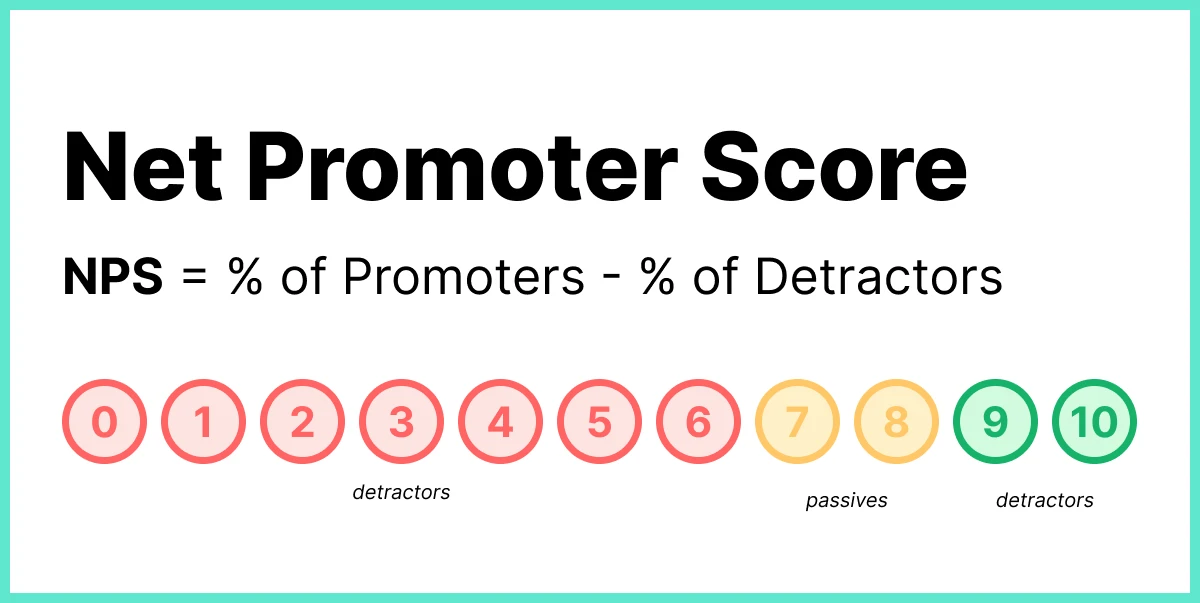
NPS is calculated by subtracting the percentage of Detractors from the percentage of Promoters. Passives don't factor into the calculation but are important for understanding your full customer base.
Step-by-Step Calculation
- Survey your customers using the 0-10 recommendation scale
- Classify responses into three groups:
- Promoters (9-10): Enthusiastic fans who drive growth through referrals
- Passives (7-8): Satisfied customers vulnerable to competitive offers
- Detractors (0-6): Unhappy customers who may damage your brand through negative word-of-mouth
- Calculate percentages of Promoters and Detractors
- Subtract the percentage of Detractors from Promoters
Example Calculation
For example, if you surveyed 100 customers:
- 60 gave scores of
9-10(Promoters) - 25 gave scores of
7-8(Passives) - 15 gave scores of
0-6(Detractors)
Calculation:
Promoters = 60 / 100 = 60%
Detractors = 15 / 100 = 15%
NPS = 60% - 15% = 45
An NPS of 45 is considered Good (30–49), though the interpretation depends heavily on your industry.
What Does Your NPS Score Mean?
Understanding your NPS score requires context. A score of 30 might be exceptional in one industry but below average in another.
Universal NPS Scale
| NPS Range | Classification | Interpretation |
|---|---|---|
| 70 - 100 | Excellent | World-class customer loyalty; exceptional performance |
| 50 - 69 | Great | Strong performance; customers are very satisfied |
| 30 - 49 | Good | Above average; room for improvement exists |
| 10 - 29 | Needs Improvement | Below average; significant issues to address |
| 0 - 9 | Poor | More detractors than promoters; critical problems |
| <0 | Critical | Serious customer satisfaction issues; immediate action required |
NPS Benchmarks by Industry
Context is everything. Here's how scores typically compare across major industries:
| Industry | Average NPS | Good Score | Excellent Score |
|---|---|---|---|
| SaaS & Software | 28-35 | 40+ | 60+ |
| E-commerce & Retail | 45-55 | 60+ | 75+ |
| Financial Services | 30-40 | 45+ | 60+ |
| Healthcare | 35-42 | 50+ | 65+ |
| Telecommunications | 20-30 | 35+ | 50+ |
| Insurance | 28-38 | 42+ | 58+ |
| Hospitality & Travel | 50-60 | 65+ | 80+ |
| B2B Services | 32-42 | 48+ | 63+ |
Why industry matters: Industries with fewer alternatives (telecom, insurance) typically have lower scores. Sectors with emotional connections (hospitality, retail) score higher. Your goal isn't perfection, but continuous improvement relative to your industry baseline.
Customer Segments
Your NPS score tells you the net result, but the real insights come from understanding each customer segment.
Promoters (Scores 9-10) — Your Growth Engine
Your brand champions. They:
- Have the highest lifetime value
- Generate referrals that cost you nothing
- Provide constructive feedback to help you improve
- Stick with you through challenges
- Often spend more than average customers
What to do with Promoters:
- Request referrals and testimonials at optimal moments
- Create ambassador or referral programs
- Ask for detailed product feedback
- Feature them in case studies
- Maintain the excellence that earned their loyalty
Passives (Scores 7-8) — Your Vulnerable Middle
Passives are satisfied but not enthusiastic. They're the most likely to switch to a competitor if given a compelling reason.
What to do with Passives:
- Uncover what's holding them back from a 9 or 10
- Engage proactively with personalized outreach
- Highlight improvements based on their feedback
- Create "wow" moments to convert them to Promoters
- Monitor closely for signs of declining satisfaction
Detractors (Scores 0-6) — Your Urgent Priority
Detractors are unhappy customers at high risk of churn and negative reviews.
What to do with Detractors:
- Contact within 24-48 hours of their response
- Listen without defending to understand root causes
- Take concrete action to resolve their issues
- Follow up to confirm satisfaction with the resolution
- Track patterns to fix systematic problems
The 80/20 Insight: Converting just 20% of your Detractors to Passives can dramatically improve your NPS and reduce churn costs.